Unreal Engine is a powerful 3D creation platform for developing photorealistic games and immersive experiences. But with a wide range of tools and settings, it’s easy to feel overwhelmed when figuring out which of UE4’s features can help your project. In this post we will go over three UE4 tools that provide insight into your project and help you improve its performance.
Using Statistics for performance insights
Having a good understanding of the different attributes of your project file is important as you’re developing your project in Unreal Engine. The Statistics chart is a valuable yet highly unused feature in UE4. It gives you information such as polycount and triangle count for each of the objects in your scene. You can use the statistics chart to organize the data in your file from highest to lowest poly count and triangle count. This provides a ton of insight into your scene’s performance, giving you an overview of your entire project.
Statistics tab showing information on all the meshes in the scene.
On a recent project that we working on for a client, we had to create a 3D visualization for an Exo-Bionic robot using Unreal Engine. The scene had 42,000 meshes which was adversely impacting the performance of our project. Using UE’s Statistics tab, we were able to identify a number of meshes in our scene with very high polycount that were slowing down the project.
Once we knew the meshes that were affecting the performance of our project, we used Unreal Engine’s LOD generator to simplify the heavy meshes resulting in improved performance. The Statistics Chart helped us quickly scan and identify the bottlenecks in our project file without having to manually go through each individual mesh in our scene.
To find the Statistics chart in your project, simply look under the “Windows” tab and select “Statistics”.
Understanding GPU performance with the GPU visualizer
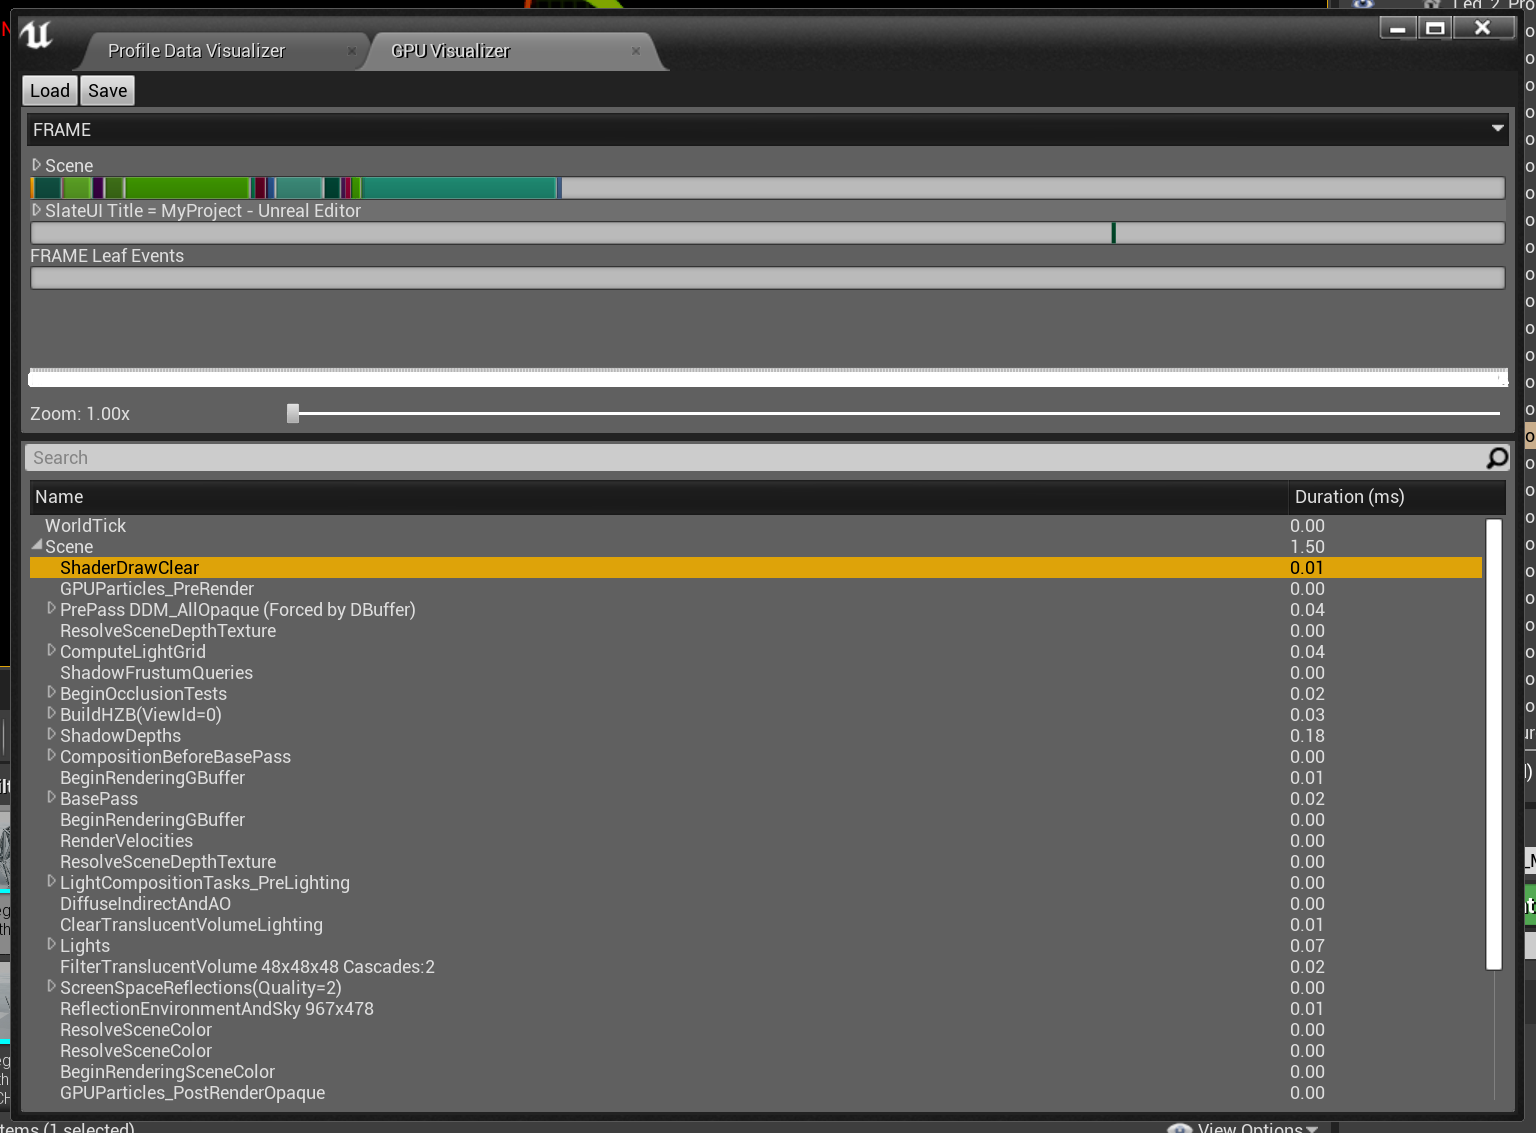
Understanding how your Unreal Engine project is utilizing your hardware resources can be very beneficial as you’re working on your project. Unreal Engine’s GPU visualizer is similar to Microsoft’s Task Manager, as it shows real-time, per-frame information on your PC’s GPU usage during rendering. By providing info on the GPU render cost of each frame, we’re able to see how many milliseconds it takes to render shaders and apply post processing effects like Anti-Aliasing and Auto Exposure. Having these metrics helps 3D developers understand possible bottlenecks in their project that may require optimization.
GPU visualizer showing how long different rendering processes take.
For example, in the previously mentioned Exo-Bionic robot project, the GPU visualizer showed that post-processing effects that were added to the scene take 0.27 milliseconds to render. This was far too long for our project, which was intended for a real-time VR visualization. With this information, we adjusted settings such as disabling Ambient Occlusion and Auto Exposure helped improve our projects overall FPS.
As you can see, the GPU visualizer is a great tool to identify rendering bottlenecks in your visualization. To run the GPU visualizer, simultaneously press “Control”, “Shift”, and “Comma”on your keyboard.
Using the Content Browser to get volumetric insights
When working on real-time visualizations, knowing the volume of a mesh is useful information, and UE’s content browser is one of the few 3D tools in the market that displays it. The content browser can be easily accessed by simply hovering over a mesh and a screen will pop up showing information such as: LOD’s, vertices, triangles, materials, and of course, volume.
Content Browser showing volume size among other data.
Having information on mesh volume can be very useful when you’re working with engineering or architectural files that weren’t designed for 3D visualization projects. These files are designed with a high-degree of accuracy and detail, such as bolts and screws. These detailed assets are sometimes so small that they’re difficult to find in Unreal Engine’s 3D previewer. However, they can be easily identified in the content browser by finding meshes with a small volume. Once these small volumetric meshes are identified, you can easily group them and delete them to significantly lighten your scene.
Final thoughts
Even though Unreal Engine is mainly known as a 3D game and VR development engine, it’s also equipped with tools that provide valuable insight into your project and help you quickly identify performance limiting bottlenecks. We hope you can use these tools on your next 3D visualization project and make it run even smoother.


